
This post is an edited excerpt of a book chapter I co-authored:
Bobe, R., d’Oliveira Coelho, J., Carvalho, S., Leakey, M., 2022. Early hominins and paleoecology of the Koobi Fora Formation, Lake Turkana Basin, Kenya. In: Reynolds, S.C., Bobe, R. (Eds.), African Paleoecology and Human Evolution. Cambridge University Press, Cambridge. DOI: 10.1017/9781139696470.026
Patterns of Faunal Associations
Introduction
The best sampled and most continuous part of the Koobi Fora Formation is from the upper Burgi Member to the Okote Member, i.e., from about 2 to 1.4 Million years ago. The fossil record of the upper Burgi, KBS, and Okote Mbs has been more thoroughly studied and published, and here we present new analyses of faunal associations based on these upper members. Ever since the first coefficient of association between species was devised by pioneer ecologist Stephen Alfred Forbes (Forbes, 1907), numerous quantitative metrics have been defined, aiming at clarifying how species combine themselves into larger communities (Dice, 1945). We use a version of Table 26.2 that includes only genera across the upper Burgi, KBS, and Okote Mbs to detect patterns of association in relation to taxonomic abundance data. All extremely rare genera (N ≤ 10) were excluded from the following analysis. To reveal faunal patterns, we employed APRIORI (Agrawal et al., 1993), an \(if \ A \ then \ B\) algorithm for mining association rules, typically used to analyze transaction data for retail markets and online e-commerce stores (Hahsler, 2017; Hahsler and Karpienko, 2017).
APRIORI applied to paleoecology
Instead of looking at transactions per se, we transformed our count data (a proxy for the abundance of taxa) of genera across geological members into “association” data. The data transformation involved three steps: first the data set was double-standardized per \(max\) value of each column (member) and per the \(sum\) of each row (genus; Legendre and Gallagher, 2001); second, a Euclidean distance matrix \(D_{mn}\) was calculated; and third, a matrix \(X_{ij}\), where each value \(ij\) is a binarized logical solution for \( D_{mn} < \overline{D}_n \).
This Boolean matrix \(X_{ij}\) can then be fed into the APRIORI algorithm to understand associations \(if \ i \ then \ j\) between any paleotaxa \(i\) and \(j\). Then, the associations calculated were analyzed, scored and ranked by the following thresholds:
$$ Support=\frac{\text{ Number of Associations between A and B }}{\text{ Total number of Associations}}=P\left(A \cap B\right) \quad (Eq. 1) $$
$$ Confidence=\frac{\text{ Number of Associations between A and B }}{\text{ Total number of Associations with A}}=\frac{P\left(A \cap B\right)}{P\left(A\right)} \quad (Eq. 2) $$
$$ Lift=\frac{Confidence}{\text{Expected Confidence}} = \frac{P\left(A \cap B\right)}{P\left(A\right) \times P\left(B\right)} \quad (Eq. 3) $$
The FARUBO webapp
Here we introduce FARUBO, a flexible web application for rule-based learning and visualization of paleofaunal associations, available through the “osteomics” web platform. FARUBO (http://osteomics.com/FARUBO) was fully developed in R using shiny, arules and arulesViz packages (Hahsler et al., 2005, 2011; Hahsler, 2017; R Core Team, 2019). FARUBO is designed with a side panel for interactive functionalities and a main panel with three menu tabs: “Data Exploration,” “Paleofaunal Network,” and “Clustered Rules.” The side panel allows users to control interactively all parameters as minimum thresholds (eqs. 1–3). The fourth parameter of the side panel, “Rules length,” allows one to define the number of taxa in the left-hand side (LHS) of the if–then rule, while the last parameters are all related to filtering taxa for the analyses. Regarding the main panel, the first tab “Data Exploration” is the landpage; it summarizes all rules being generated in real-time by the web application and it allows users to download them anytime as a .csv table. In the “Paleofaunal Network” tab, interactive networks of associations can be visualized; in the default display, circle size increases with support and circle shading saturates (to red) with confidence, while the rules’ number decreases with lift. If hundreds or thousands of rules are being generated the graph visualization gets too convoluted, and therefore users can alternatively use the “Clustered Rules” tab to see a summarized visualization of the rules. The current version of the webapp loads with the hominins as required RHS (right-hand side) taxa, but this is also an option that can be manipulated in the side panel. Homo associations tend to rank higher than Paranthropus in terms of Support and Confidence, but lower in terms of Lift. This is due to Paranthropus being comparatively underrepresented in the upper Burgi Mb, which leads to lower expected confidence.
Results: Part I
For the results presented here, we defined the same minimum thresholds of support = 0.4, confidence = 0.6, and lift = 1, as in the web application defaults, resulting in 23 association rules. The top 10 identified rules (Figure A) show the major importance and representativeness of Theropithecus (9/10 rules) overall for hominin assemblages, with Metridiochoerus following closely (but more relevant toward Paranthropus). Indeed, the best rule in terms of lift (1.938) was \((Metridiochoerus, Theropithecus) ⇒ (Paranthropus)\) with 81.3 percent confidence, while the top five rules for Homo all contained Theropithecus in the LHS. From this, their combined potential as paleontological predictors for hominins in the region can be inferred. Both Theropithecus and Metridiochoerus are more abundant than hominins, and thus are easier to detect during paleontological surveys.
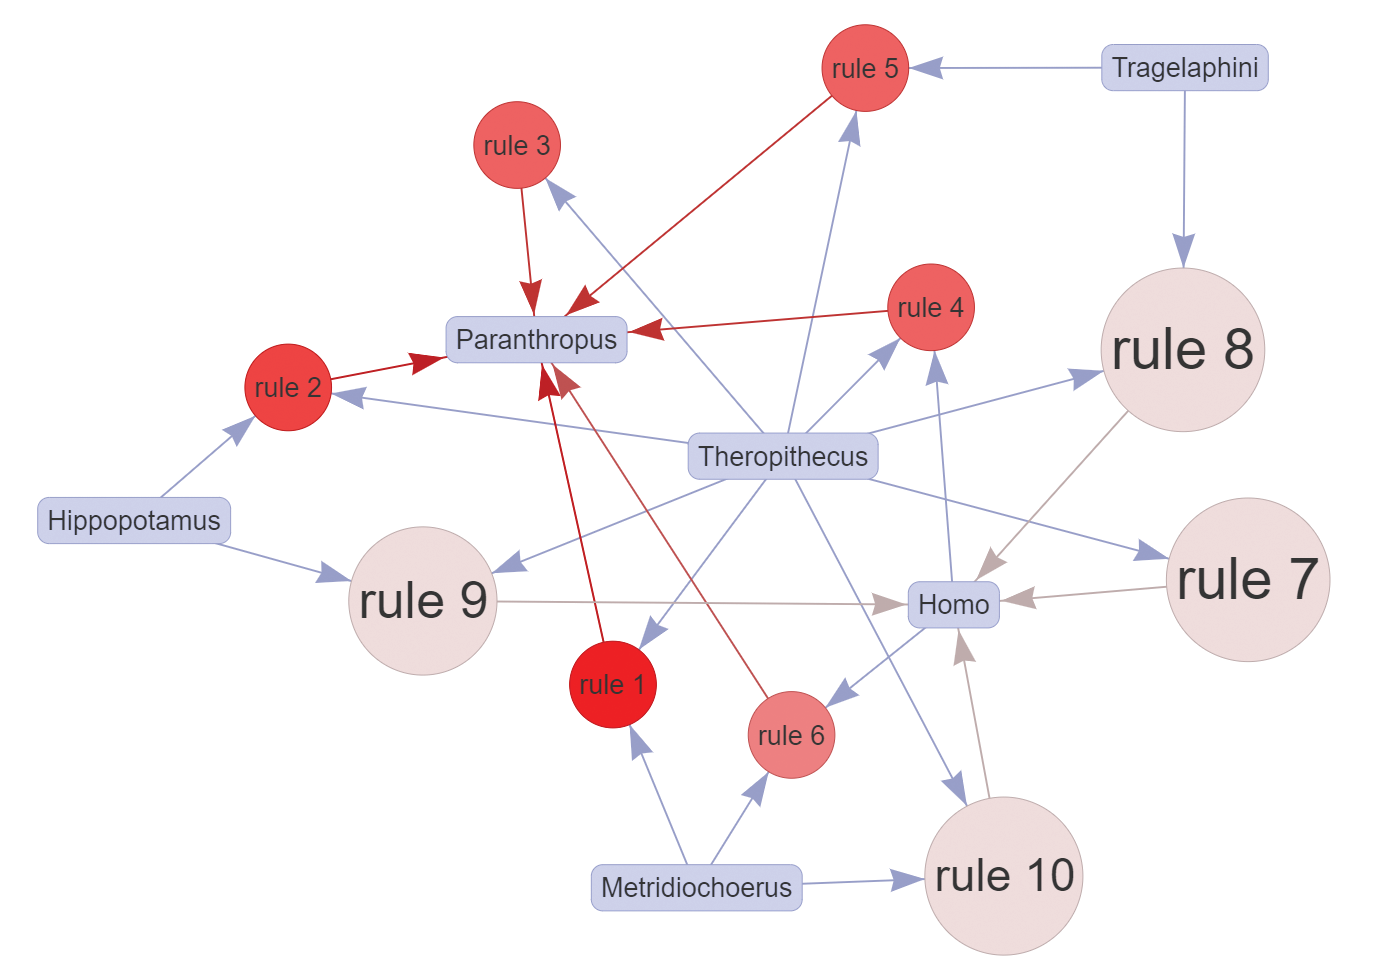
The fossil record indicates that Theropithecus was a successful primate lineage, comparable to some early hominins in terms of geographic range and terrestriality (Elton, 2006). At the site of Olorgesailie in Kenya, there is direct evidence of coexistence and interactions between Theropithecus and Pleistocene hominins from cut-marked bones of T. oswaldi (Shipman et al., 1981). Additionally, Theropithecus has been central as a comparative model for hominin locomotor evolution (Jolly, 1970; Wrangham, 1980; Kingdon, 2003) and behavioral adaptations (e.g., diet) to changing habitats and climate (Dunbar, 1983; Foley, 1993). As for Metridiochoerus and its stronger association to Paranthropus, we tentatively attribute this to overlapping habitat preferences, and to possibly similar strategies of resource exploitation. It is known that in eastern Africa grasses were an important component of both of their diets, and Metridiochoerus species (advanced forms of the genus) have been interpreted as indicators among suids of seasonal grassland habitats (Bobe and Behrensmeyer, 2004). However, taphonomic factors likely play a role: Paranthropus and Metridiochoerus teeth are both abundant in the fluvial deposits of the KBS Mb, where their durable teeth may survive better during fluvial transport.
Also important are the hominin associations to Hippopotamus and Tragelaphus most likely demonstrating the importance of close sources of fresh water and trees in the life history of hominins. Furthermore, if we look at the lower-ranking rules, we see that Crocuta is also associated with Homo in multiple rules (but with lower support values), and other bovid tribes such as Reduncini and to a lesser extent Bovini also show some degree of association to the hominins (not depicted), which further illustrates the complexities of the environmental context.
Results: Part II
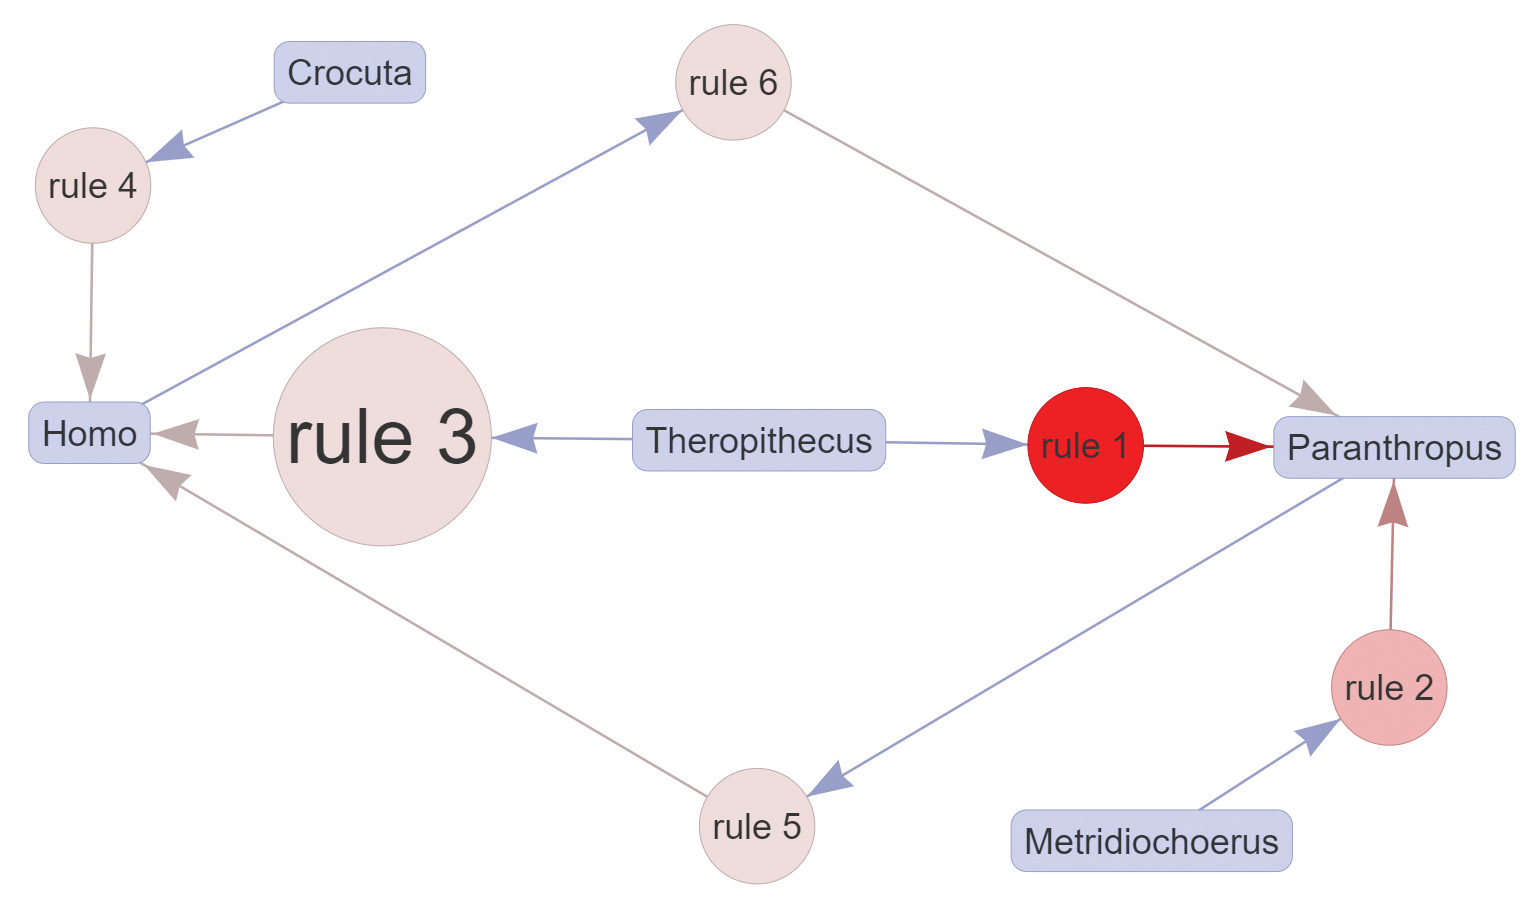
It is also possible to look exclusively at paired associations, that is, associations that do not need combined taxa to be detected. As an example, if one is only interested in pair relationships related to hominins, the maximum value of the “Rules length” parameter should be kept at 2 in FARUBO, and “Homo” and “Paranthropus” have to be selected in “Require taxa in RHS.” Considering only pair relationships, the association of Crocuta with Homo becomes more evident (lift = 1.192; Figure B), and this might indicate commonalities in the way both taxa exploited resources, as the Homo lineage is thought to have increasingly adopted meat and marrow into its diet by opportunistic scavenging and eventually by hunting (Moleón et al., 2014). Further relaxing the minimum support value in FARUBO will allow users to detect a few more interesting pair associations with Homo that might also indicate some ecological overlaps, notably Dinofelis and Parapapio at 29 percent support and Panthera (25.8 percent).
The evolutionary and ecological significance of these associations needs further work to assess the role of collection biases and taphonomic factors such as the durability of teeth and mandibles in different depositional contexts (Behrensmeyer, 1975, 1978, 1985). Thus, these associations are best considered as tentative hypotheses to be tested with further taphonomic analyses.
References
- Agrawal, R., Imieliński, T., Swami, A., 1993. Mining association rules between sets of items in large databases, Proceedings of the 1993 ACM SIGMOD International Conference on Management of Data., ACM, New York, pp. 207–216.
- Behrensmeyer, A.K., 1975. Taphonomy and paleoecology in the hominid fossil record. Yearbook of Physical Anthropology. 19, 36–50.
- Behrensmeyer, A.K., 1978. Taphonomic and ecologic information from bone weathering. Paleobiology. 4, 150–162.
- Behrensmeyer, A.K., 1985. Taphonomy and the paleoecologic reconstruction of hominid habitats in the Koobi Fora Formation. In: Coppens, Y. (Ed.), L’Environment Des Hominides Au Plio-Pleistocene. Masson, Paris, pp. 309–324.
- Bobe, R., Behrensmeyer, A.K., 2004. The expansion of grassland ecosystems in Africa in relation to mammalian evolution and the origin of the genus Homo. Palaeogeography, Palaeoclimatology, Palaeoecology. 207, 399–420.
- Dice, L.R., 1945. Measures of the amount of ecologic association between species. Ecology, 26, 297–302.
- Dunbar, R.I.M., 1983. Theropithecines and hominids: Contrasting solutions to the same ecological problem. Journal of Human Evolution. 12, 647–658.
- Elton, S., 2006. Forty years on and still going strong: the use of hominin-cercopithecid comparisons in palaeoanthropology. Journal of the Royal Anthropological Institute. 12, 19–38.
- Foley, R.A., 1993. African terrestrial primates: the comparative evolutionary biology of Theropithecus and the Hominidae. In: Jablonski, N.G. (Ed.), Theropithecus. Cambridge University Press, pp. 245–270.
- Forbes, S.A., 1907. On the local distribution of certain Illinois fishes: an essay in statistical ecology. Bulletin of the Illinois State Laboratory of Natural History, 7, 273–303.
- Hahsler, M., 2017. arulesViz: Interactive Visualization of Association Rules with R. The R Journal, 9, 163-175.
- Hahsler, M., Chelluboina, S., Hornik, K., Buchta, C., 2011. The arules R-Package Ecosystem: analyzing interesting patterns from large transaction data sets. Journal of Machine Learning Research, 12, 2021–2025.
- Hahsler, M., Grün, B., Hornik, K., 2005. arules - A computational environment for mining association rules and frequent item sets. 2005 14, 25.
- Hahsler, M., Karpienko, R., 2017. Visualizing association rules in hierarchical groups. Journal of Business Economics, 87, 317-335.
- Jolly, C.J., 1970. The Seed-Eaters: A New Model of Hominid Differentiation Based on a Baboon Analogy. Man. 5, 5–26.
- Kingdon, J., 2003. Lowly Origin: Where, When, and why Our Ancestors First Stood Up. Princeton University Press.
- Legendre, P., Gallagher, E.D., 2001. Ecologically meaningful transformations for ordination of species data. Oecologia, 129, 271-280.
- Moleón, M., Sánchez-Zapata, J.A., Margalida, A., Carrete, M., Owen-Smith, N., Donázar, J.A., 2014. Humans and Scavengers: The Evolution of Interactions and Ecosystem Services. BioScience. 64, 394–403.
- R Core Team, 2019. R: A Language and Environment for Statistical Computing. R Foundation for Statistical Computing, Vienna.
- Shipman, P., Bosler, W., Davis, K.L., Behrensmeyer, A.K., Dunbar, R.I.M., Groves, C.P., Thackeray, F., Couvering, J.A.H.V., Stucky, R.K., 1981. Butchering of Giant Geladas at an Acheulian Site [and Comments and Reply]. Current Anthropology. 22, 257–268.
- Wrangham, R.W., 1980. Bipedal locomotion as a feeding adaptation in gelada baboons, and its implications for hominid evolution. Journal of Human Evolution. 9, 329–331.